The latest VisitEngland Attractions Survey Results
- Attractions in England reported an 11% increase in the volume of total visits from 2022 to 2023, however this is still 28% below 2019 levels.
- The average percentage increase in visitors from 2022 to 2023 for attractions in the North East Region is approximately 7%.
- Rising costs and the ongoing cost of living crisis have hampered growth and posed barriers to visitors taking domestic visits.
- Top performers in our region include Beamish Museum, National Trust properties Gibside and Cragside, Locomotion in Shildon and Sunderland Museum and Winter Gardens
- In 2023, the sector grew due to an increase in overseas visits to attractions (+80% on 2022) and an increase in school trips in 2023. Overall, sites reported a 2% decline in domestic visits.

VisitEngland has published its 2023 Annual Survey of Visits to Visitor Attractions showing that while visits to attractions across England continued to recover last year, they were still significantly down on pre-pandemic levels.
Overall, visits to attractions in England continued to increase and were up 11% in 2023 compared to 2022 with the rate of growth slower than in the previous two years and with numbers down 28% on 2019 (see slide 7 of full trends report).
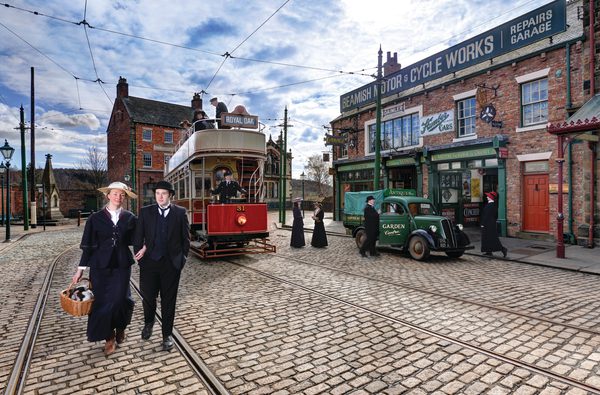
The highest levels of growth were seen in the ‘Museum/Art Galleries’ category, which suffered one of the sharpest declines in visitors because of COVID-19, with a 20% increase in visits in 2023 compared to 2022. Beamish Museum in County Durham ranks 17th nationally, making it one of England's most visited attractions, with over 800,000 visitors. No other North Eastern attractions however feature in the top 20.
Attractions in the region have reported an increase of over a quarter of a million since 2022.
Read on to see what the outlook for the North East looks like.
Top North East Free Attractions
- BALTIC Centre for Contemporary Art - 411,200
- Sunderland Museum & Winter Gardens Museum - 269,588
- Great North Museum: Hancock - 245,800
- Discovery Museum - 185,157
- Locomotion - 125,121
- Palace Green Library, Durham University - 110,560
- Fusiliers Museum of Northumberland - 99,892
- Laing Art Gallery - 93,802
- South Shields Museum and Art Gallery - 85,646
- World Heritage Site Visitor Centre - 50,655

Top Paid North East Visitor Attractions
- Beamish,: The Living Museum of the North - 801,756
- Wallington House, Gardens & Estate - 250,807
- Cragside - 244,988
- Gibside - 210,454
- Centre for Life - 170,129
- Housesteads Visitors Centre - 104,128
- Vindolanda (Chesterholm) Hadrian's Wall 93,935
- Belsay Hall, Castle and Gardens - 82,862
- Housesteads Roman Fort - 81,331
- The Bowes Museum - 77,999

The outlook for the North East
So what does this mean for the region?
The latest figures show the challenge and the opportunity at North East England's feet. Whilst the quality of our product is fantastic, the breadth of our offer is not represented in the national top 20, with only Beamish Museum making an appearance. Beamish also records more than double the visitor numbers of all of the other attractions featured - demonstrating a need to level the playing field so that visitors experience more of the region's attractions.
There is of course an ongoing need for investment - we have seen in 2023's STEAM data that investments in County Durham for example have allowed for record leaps in day visitors. Animating places with major events and taking advantage of key travel trends like gig tourism has also seen areas like Sunderland record strong overnight visitor numbers thanks to major concerts at the Stadium of Light. A curated programme of major concerts, regular cultural programmes and world-class live events can help put the region on the map and increase footfall to our year-round attractions.
The data also omits some key big attractions in the region, who have either not submitted a response to the VisitEngland survey or have opted to not have their figures published. More needs to be done to encourage businesses to participate in these studies, so a clearer picture of the region's attraction landscape can be viewed.
In our latest quarterly research report, we can see the impact the cost of living crisis is having on domestic visits and this demonstrates that if people are making fewer trips, we need to work harder to convince people that they should come here.
One way we can do this is by emphasising how the region represents excellent value for money. The region has an abundance of free, world-class attractions, stunning national parks and landscapes, exceptional coastlines and compact walkable cities. Whilst there are still challenges with public transport in more rural parts of the region, the Tyne and Wear Metro system means visitors don't have to spend a fortune to move around and explore. Visitors get far more bang for their buck than in neighbouring destinations. This recent Which? report also highlighted that hotels in Newcastle are comparatively inexpensive, with plenty of affordable and diverse accommodation options right across the North East.
The survey, which gathered information from 1,513 English attractions, shows that growth was fuelled by the return of overseas visitors and an increase in school trips in 2023. International visits to England’s attractions were up 80% last year compared to 2022. Domestic visits to attractions in 2023 meanwhile saw a decrease of 2% on the previous year.
Most regions saw admissions grow between 4-8% with London the exception seeing growth of 26% largely driven by international visitors. Despite the high percentage increase the volume of attraction visits in London remains well below 2019 levels, at -22%.
The annual trends report provides an overview of the visitor attraction sector using results from a mix of online and postal surveys. This approach means we’re unable to verify results provided by individual attractions beyond a basic ‘sense check’. Read more about VisitEngland's methodology (PDF, 1.38 MB).
The lists of English attractions included in the report only feature those that choose to participate and agree to make their results public.
The Annual Survey of Visits to Visitor Attractions is designated as official statistics
